ABSTRACT
Commercial rheometers typically rely on internal data acquisition and correlation systems to generate dynamic mechanical test results. This approach has the advantage of being integrated with the rest of the instrument hardware and software control systems, but limits the overall performance of the system to the capabilities of the internal electronics and processing firmware. This limitation is not an issue at low test frequencies, where the time required to obtain a data point is related to the period of oscillation, but at higher tests frequencies data rates generally top out at about 1-2 points per second regardless of measurement frequency.
For most materials this limitation is not a problem, since the rheological properties of most materials generally do not change that rapidly over time, and maximum temperature ramping rates tend to be limited by the thermal mass of the material and test fixtures rather than data acquisition rates. There are, however, classes of reactive systems (for example UV cures) that undergo very large changes in viscoelastic properties in a relatively short period of time. In this case performance of most rheometers is not sufficient to accurately model the kinetics of these materials.
In this paper a new approach to fast rheological measurements will be discussed where an off-the-shelf external Analog to Digital conversion system is integrated with rheometer control and analysis software, and used to obtain dynamic mechanical data at rates of over 60 points per second. This technique is only applicable to rheometers using separate motor and transducers, where the analog voltages corresponding to measured torque and motor displacement are readily accessible.
INTRODUCTION
Dynamic mechanical analysis (DMA) is a well-known method used to measure the viscoelastic properties of materials such as polymers and structured fluid systems. Unlike conventional viscometer measurements, DMA allows for the measurement of both the viscous and elastic properties of the materials being tested. This information can be used for such things as to gain insight in the processing behavior of molten polymers, and the end-use properties of high-performance engineering plastics. DMA can also be used to look at structured fluids such as paste and foodstuffs, and correlations can be made between these properties and factors such as “mouth feel” in the case of foods, and flow and leveling in the case of paints.
In Dynamic Mechanical Analysis a sinusoidal stress or strain signal is imposed on a sample confined to a well-defined geometry. Measurements can be made using either shear geometries (e.g. parallel plate or cone and plate), or in linear geometries (e.g. rectangular/cylindrical tension-compression, or bending). In all cases however both the stress and strain as a function of time must be either measured or deduced. Since the sample geometry is known, determining stress and strain on the sample is a matter of measuring or calculating the motor displacement and torque as a function of time, and then multiplying by the appropriate geometry constants.
The measurement of dynamic mechanical parameters from the transient stress and strain signals involves the calculation of the magnitude of each of these sinusoidal signals and the phase shift between them. From these parameters it is possible to calculate all of the conventional DMA variables such as the complex viscosity (h*), elastic and loss moduli (G’, G”), and tan d.
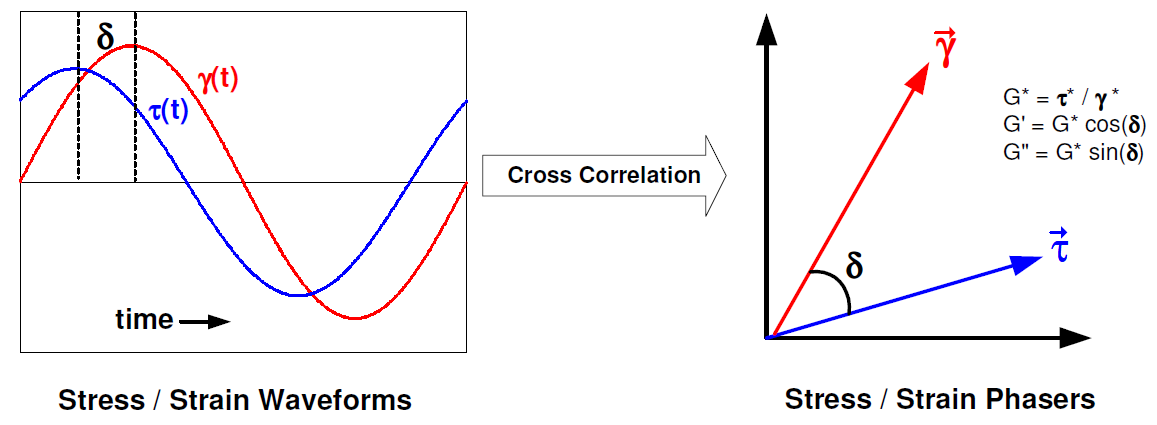
Figure1 Dynamic Mechanical Signals
Calculation of the amplitude of the stress and strain signals, and the phase shift between them can be done using a variety of techniques, however most rheometers use either a Discrete Fourier Transform (DFT) or a cross-correlation algorithm. In the case of cross correlation, the incoming stress and strain signals are correlated against two reference sine waves of the same frequency, that are shifted in phase by 90º from each other. This algorithm offers very good noise rejection, particularly if data are integrated over several cycles of oscillation (1).
The ARES rheometer used in this study uses two dedicated A/D converter to sample the torque and displacement signals, with the number of cycles used for the correlation, and number of points per cycle being a function of frequency, with the total number of raw samples used for the data correlation generally fixed at 2048 (2). The actual time required to generate a single dynamic mechanical data point is of course tied to the measurement frequency, plus any time required by the instrument microprocessor and firmware to do the actual calculations. At frequencies below 2 rad/s, where a single cycle is used, the minimum measurement time is between 1 and 1 1/2 cycles of oscillation. At higher frequencies the limiting factor in the rate at which dynamic data can be obtained is not governed by the measurement period, but rather the instrument firmware.
In most applications this limitation is not a factor, since the rheological properties being measured are either relatively constant, or changing slowly enough that they can still be accurately measured using conventional data acquisition and correlation systems. For materials where the rheology is rapidly changing (for example, curing materials or structured fluid systems which may break down under shear) this limitation may prevent accurate measurement of these changing properties over time.
With this in mind a system was developed for performing dynamic mechanical analysis experiments at significantly higher data rates using an off-the-shelf external A/D converter and special software to perform the necessary calculations and automatically send the data stream to the instrument data presentation software.
EXPERIMENTAL
Dynamic mechanical analysis measurements were made using ARES rheometer (TA Instruments). This instrument contains a rotational motor that applies a shear strain to sample, and a force rebalance transducer (FRT) that measures the resulting torque and normal force. The output signals for both the motor and transducer are easily accessible via BNC connectors on the back of the instrument. The signals are scaled to ± 5 V full scale, corresponding to nominal values of ± 2000 gm-cm or ± 200 gm-cm torque (depending on transducer setting), and ± 0.5 radians of angular displacement for the motor.
These signals were digitized using a National Instruments DAQPad-6020E USB-based analog to digital converter (DAQ), which features 8 dual-ended analog input channels with 12-bits of resolution, 8 digital I/O lines, and a maximum sampling rate of 100 kS/s. A special software module (RheoCorr) was written to interface this acquisitions system to the rheometer control software (TA Instruments Orchestrator), which allows Orchestrator to control the external DAQ hardware, send over the appropriate scaling constants (transducer calibration factors, geometry constants, etc.), and to receive the calculated dynamic mechanical properties. An ActiveX control provided by National Instruments (NI-DAQ) was used to interface the DAQ to the RheoCorr software.
Viscoelastic parameters were calculated from the sampled data using the crosscorrelation algorithm discussed above. There are, however, several additional factors that need to be considered in order to obtain accurate data. The first is the fact that the A/D hardware is multiplexed in such a way that the individual torque and displacement samples do not occur at the same point in time. This delay can be corrected by querying the driver software for the intra channel delay time, and adjusting the calculated phase shift by the appropriate amount based on the delay time and the measurement frequency. Another factor to consider is that the analog electronics in the rheometer itself have a frequency-dependent phase shift (a correction that is normally done in the instrument firmware), and this correction is taken into account in a similar fashion. Transducer compliance (3) was compensated for by modeling the transducer as a spring with a fixed compliance constant.
Rheological measurements were obtained on a sample of polydimethyl siloxane (PDMS, General Electric SE30), measured using a 25 mm diameter parallel plate geometry at room temperature in order to compare the accuracy of the external correlator to the data generated by the conventional ARES electronics.
The ability of this measurement system to follow the rheological properties of fast reacting systems was tested by monitoring the change in complex viscosity (h*) of a urethane based UV curing system. In this experiment the uncured polymer solution was tested using a 38.1 mm diameter quartz parallel plate upper fixture, and a standard 50 mm diameter stainless steel bottom plate. A Novacure 2100 (Exfo) UV source was used to generate the ultraviolet light, which was passed through a 320 – 500 nm filter. The Novacure unit provides digital I/O lines for controlling the lamp shutter, and an analog output signal corresponding to the intensity of the UV signal. These signals where connected to the acquisition hardware, which allowed the rheometer software to both control and monitor the UV intensity during measurements. Twin light pipes, mounted above the quartz upper plate were used to illuminate the sample with the UV radiation. Although this arrangement did not provide a uniform distribution of light over the area of the quartz plate, it proved sufficient for testing purposes.
RESULTS AND DISCUSSION
Accuracy of Data Correlation System
Figure 2 shows a comparison of frequency sweep data generated using the external correlator software to the data generated by the ARES electronics using the PDMS sample. Data were run using a series of frequencies from 0.1 to 100 rad/s and a strain amplitude of 5%, well within the linear viscoelastic range of the material.
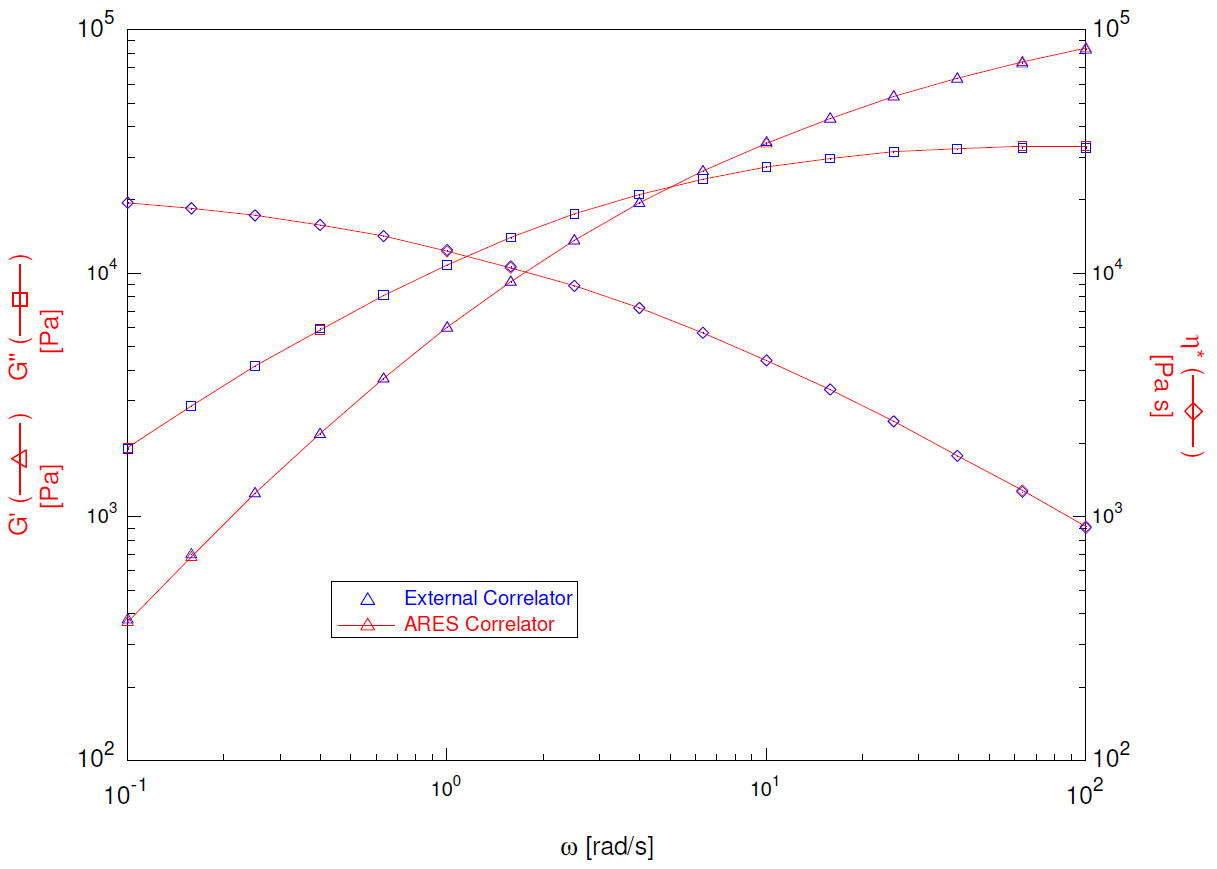
Figure 2 Frequency Sweep PDMS
The actual data were generated using a series of time sweeps at each frequency, with multiple data points collected at each rate in order to determine the repeatability of the data. As can be seen from the plot, the two sets of measurements are essentially equivalent to each other over the frequency range examined.
The data generated by the ARES rheometer showed better repeatability from measurement to measurement within a single test frequency, which is most likely due to better resolution in the ARES DAQ, which uses a 9-bit auto ranging algorithm coupled with a 16-bit DAQ to provide an effective resolution of 25 bits relative to the full-scale signal voltages. The average relative standard deviation (RSD) in modulus values over the frequency range examined was found to be 0.04% for the ARES data, in contrast to 0.33% for the external correlation system. A similar trend was found in the phase angle measurements, where the ARES results showed an average of 0.015% for the relative standard deviation at each frequency, and the external correlator data was found to have an average RSD of 0.315%.
In general, the difference between the modulus and phase angle values calculated by the ARES and the results calculated by the external correlator system are generally within about 0.5% of each other as shown in Figure 3. The errors tend to be larger at lower frequencies, as would be expected since the torque levels measured are smaller. Also, no significant trend is seen in the errors at high frequencies, which indicates that the corrections used for compensating for transducer compliance, and phase errors work well, since these effects are much larger at high frequencies.
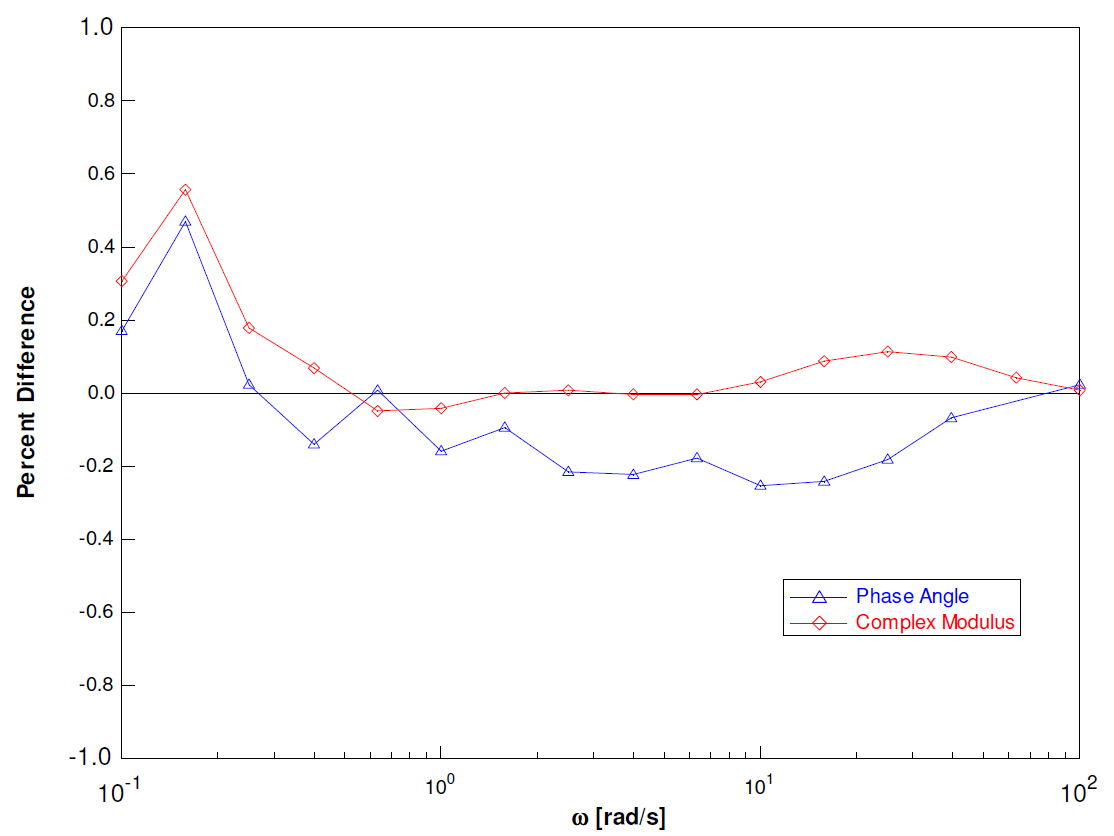
Figure 3 Modulus and Phase Deviations versus Frequency
Measurements made using the external data acquisition system shows that it is possible to reliably generate dynamic mechanical data at a rate corresponding to a time period about 20% greater than the period of the measurement frequency. At a test frequency of 100 rad/s this corresponds to approximately 13 points per second, at 500 rad/s (the upper frequency limit for the ARES) 66 points per second can be consistently obtained. The additional time provided in each measurement cycles allows the software to marshal the raw data from DAQ driver to the data calculation and presentation functions. Note that in cases where the maximum number of points is not needed, the accuracy of the results can be improved by running the data correlation over several cycles of measurement.
Application to Fast Curing Systems
Previous studies (4) have used similar experimental setups, and have relied on the fact that the cross-linking reaction can be “stepped”, and then quenched by exposing the sample to short bursts of UV light. The rheological properties can then be measured after each exposure, to monitor the progress of the reaction. Our goal here was to see if it is possible to provide a system for collecting data that is fast enough to be able to measure the rheology of such systems in situ as the reaction progresses over time.
Figure 4 shows a plot of h* versus time for the UV-curing polymer system, during which it was exposed to a 5 second pulse of UV radiation with an average intensity of approximately 50 mW/cm2, occurring about 130 seconds into the test. The data were measured using a frequency of 312 rad/s (50 Hz) and a strain amplitude of 5%. As previously noted, the UV exposure was not uniform across the area of the plate, so the degree of cure was not consistent in the same.
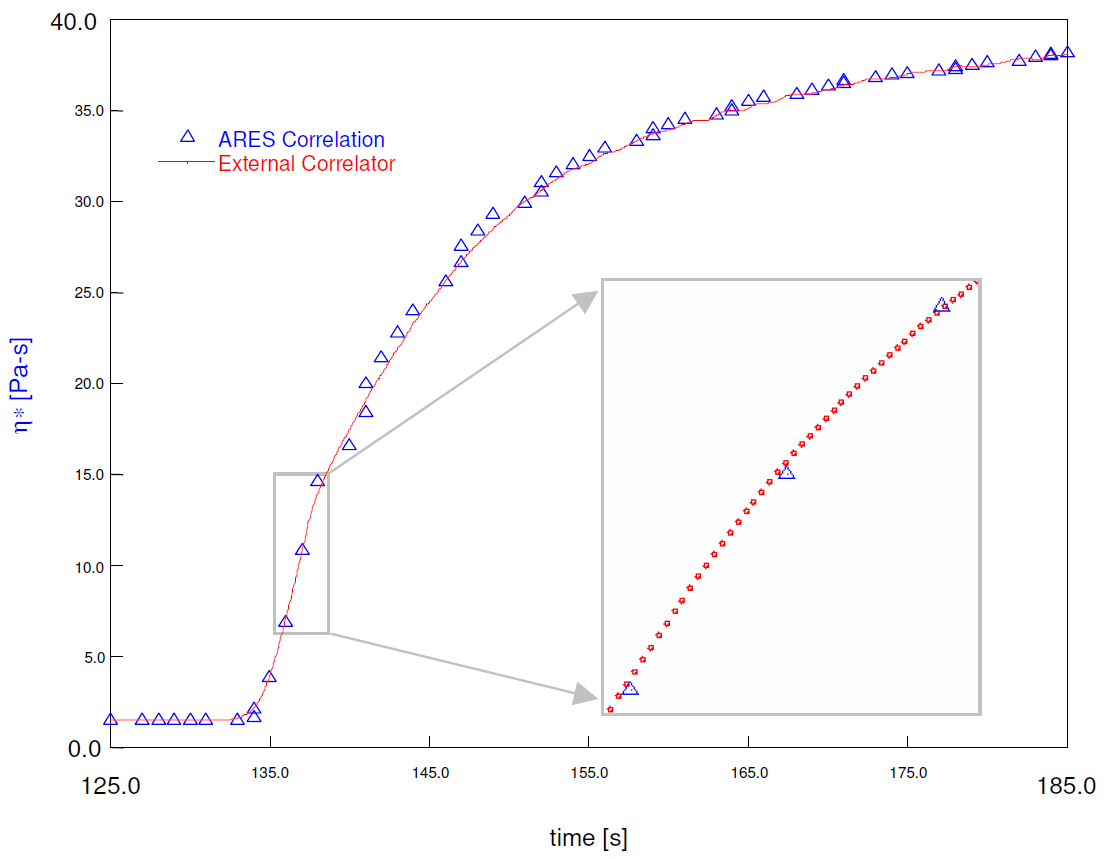
Figure 4 Complex Viscosity (h*) versus Time for UV Curable polymer system
This plot shows good agreement between the values obtained using both correlation systems. It is also apparent from the plot that the data generated by the external correlator allows the cure to be monitored with a much greater degree of accuracy due to the fact that the data collection is occurring at a rate of approximately 20 points per second, versus 1 point per second in the case of the ARES electronics.
Real-time Waveform Monitoring
This system also provides a means for monitoring the torque and strain waveforms graphically in real time, which can be used to spot problems in measurements such as low signal amplitudes, sample slippage, or material nonlinearity. Figure 5 shows a screen capture of the RheoCorr software showing a the torque signal used for correlation obtained on a sample of toothpaste run at a frequency of 50 Hz, and a strain amplitude of 20% (outside of the linear region for the sample).
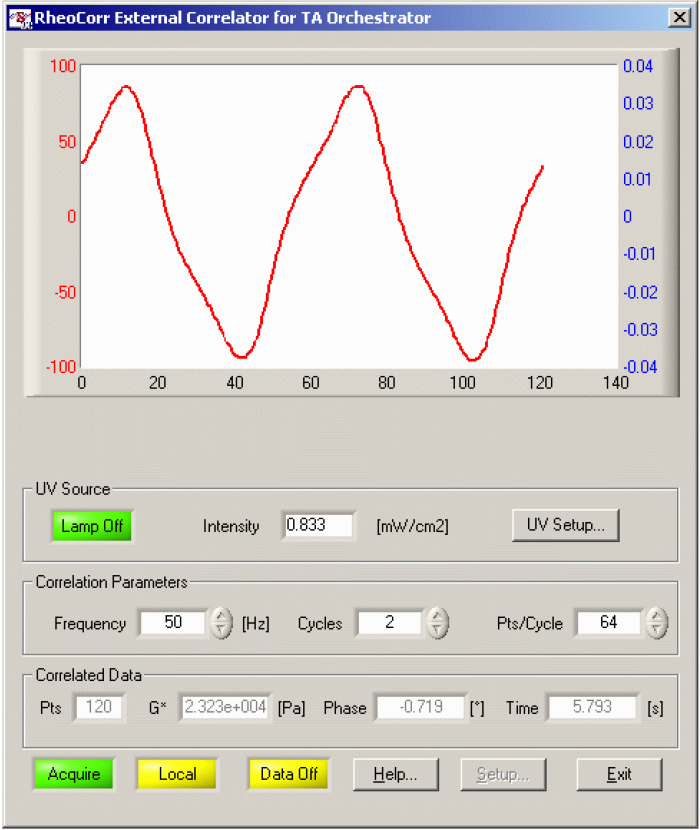
Figure 5 Screen Capture showing Torque Waveform
The results show that at this strain level the torque waveform is noticeably asymmetric due to a nonlinear response in the sample.
CONCLUSIONS
A new system has been developed for obtaining dynamic mechanical analysis data in an ARES rheometer at a much faster data rate than is possible using the standard instrument electronics and software. This system uses external data acquisition hardware to sample the analog torque and strain data from the rheometer, and special software to analyze this data in real-time, calculating rheological parameters from these signals. These parameters are then passed to the rheometer control and analysis software, where they can be displayed and manipulated as standard data sets. The results show that data obtained with this system are in good agreement with the data generated by the standard ARES firmware and software.
This system can be used to study the rheology of fast reactive materials (such as UVcurable polymers) where the rapid change in rheological properties is difficult to follow with the standard data collection rates offered by the ARES and similar rheometers.
REFERENCES
1. C. W. Macosko, Rheology: Principles, Measurements, and Applications, 1994, VCH Publishers, Inc.
2. T.A. Instruments, Inc. ARES User Manual (2003).
3. M. Gottlieb and C. W. Macosko, Rheologica Acta, 1982, 21, 90-94.
4. S. A. Khan, et al. Rheologica Acta, 1992, 31, 151-160.
KEYWORDS
cure, fast data acquisition, oscillation, data sampling